Menu Prices Up 3.5% Through September as Paychecks Lag: Why Buyers Will Question Your Sales Growth
MARKET WATCH
Federal data released Oct. 14 show restaurant prices rising faster than wages and nearly twice as fast as grocery prices. For anyone selling a restaurant, sales growth built on price alone is now easier to spot.
By SYR Staff | Oct 15, 2026
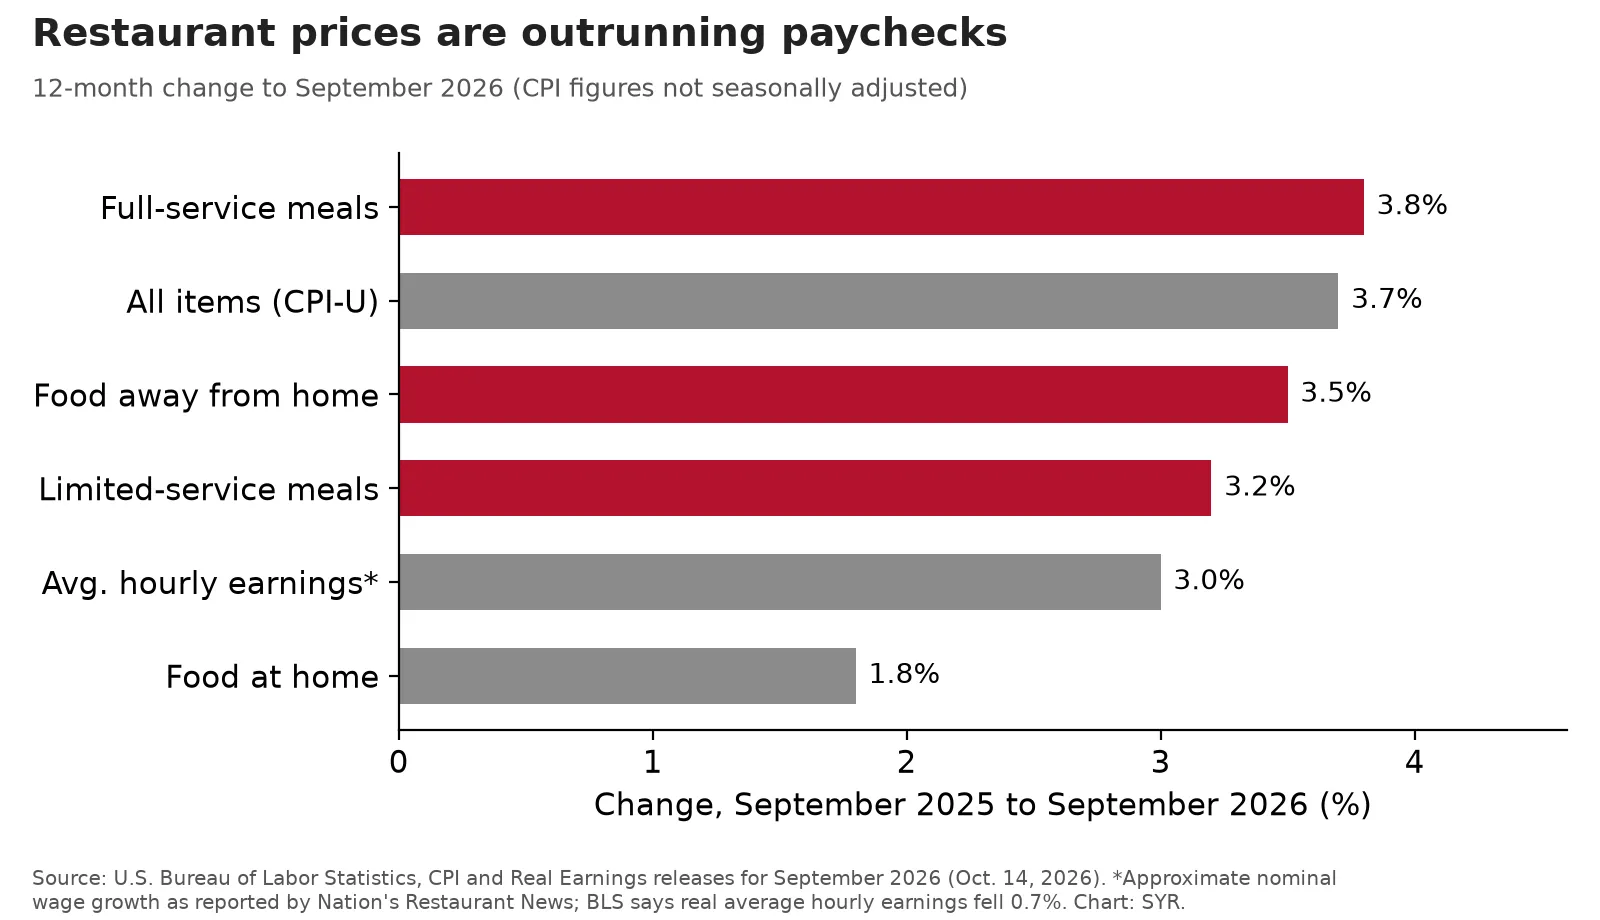
12-month price and wage changes to September 2026. Source: U.S. Bureau of Labor Statistics (Oct. 14, 2026); wage figure as reported by Nation's Restaurant News. Chart: SYR.
Restaurant prices kept climbing in September, and diners' paychecks didn't keep up. Nation's Restaurant News, reporting on federal data released Oct. 14, said menu prices were up 3.5% from a year earlier. The Bureau of Labor Statistics figures show restaurant prices running well ahead of grocery prices and of real wages.
The numbers (12 months to September 2026)
- Food away from home: +3.5%
- Full-service meals: +3.8%
- Limited-service meals: +3.2%
- All items (headline CPI): +3.7%
- Food at home (groceries): +1.8%
- Average hourly earnings: up about 3% before inflation, per NRN. After inflation, BLS says real average hourly earnings fell 0.7%.
Traffic is the other half of the picture. NRN cited Revenue Management Solutions data showing quick-service sales up just 0.6% in the third quarter while traffic fell 2.6%, and a 13.6% year-over-year drop in the University of Michigan's consumer sentiment reading for October.
“A buyer is paying for guests, not for last year's price increase.”
Why it matters at the deal table
With menu prices rising about 3.5% a year, a restaurant can post higher sales while serving fewer people. A careful buyer will notice, and so will a lender or appraiser looking at trends. A buyer is paying for guests, not for last year's price increase.
- Sellers: break sales growth into its parts. Show monthly covers or check counts and average check alongside revenue.
- Sellers: if traffic is down, explain why, whether it's road construction, a lost office tenant or a menu change, and what you're doing about it.
- Buyers: ask for transaction counts from the POS, not just sales totals. Flat revenue with a rising average check can mean a shrinking customer base.
- Both: watch the gap between menu and grocery inflation. When eating out gets pricier relative to eating in, value-driven concepts feel it first.
Key Takeaways
- Menu prices rose 3.5% in the year to September; full-service prices rose 3.8%.
- Grocery prices rose 1.8%, and real hourly earnings fell 0.7%.
- Quick-service traffic fell 2.6% in Q3 even as sales edged up, per RMS data reported by NRN.
- Sellers should show traffic and average check separately. Buyers should ask for transaction counts.
Sources
Nation's Restaurant News, "Menu price inflation is up, and wages aren't keeping pace" (Jonathan Maze, Oct. 14, 2026): https://www.nrn.com/restaurant-finance/menu-price-inflation-is-up-and-wages-aren-t-keeping-pace
U.S. Bureau of Labor Statistics, Consumer Price Index, September 2026 (USDL-26-1574, Oct. 14, 2026): https://www.bls.gov/news.release/cpi.nr0.htm
U.S. Bureau of Labor Statistics, Real Earnings, September 2026 (USDL-26-1575, Oct. 14, 2026): https://www.bls.gov/news.release/realer.nr0.htm
Images and Graphics
Chart: original SYR chart built from BLS CPI and Real Earnings figures (Oct. 14, 2026), with the nominal wage figure as reported by Nation's Restaurant News.